پرونده:Chanchu 2006-05-10 2111Z QuikSCAT.jpg

پروندهٔ اصلی(۹۷۴ × ۹۷۴ پیکسل، اندازهٔ پرونده: ۱٫۹ مگابایت، نوع MIME پرونده: image/jpeg)

توضیح

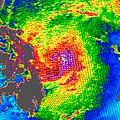
Typhoon Chanchu Typhoon Chanchu is shown here as observed by NASA’s QuikSCAT satellite on May 10, 2005, at 21:11 UTC (5:11 a.m. May 11 local time). At this time, the typhoon had 140 kilometers per hour (85 miles per hour; 75 knots) sustained winds. At the time of this observation, Chanchu had just crossed the threshold to typhoon status only a few hours later, having been classified as a weaker tropical cyclone in the previous two days since the storm system formed.

The image depicts wind speed in color and wind direction with small barbs. White barbs point to areas of heavy rain. The highest wind speeds, shown in purple, surround the center of the storm.

Measurements of the wind strength of Typhoon Chanchu show sustained winds slightly higher than those shown by QuikSCAT observations. This is because the power of the storm makes accurate measurements difficult. The scatterometer sends pulses of microwave energy through the atmosphere to the ocean surface, and measures the energy that bounces back from the wind-roughened surface. The energy of the microwave pulses changes depending on wind speed and direction, giving scientists a way to monitor wind around the world.

Tropical cyclones (the generic term for hurricanes and typhoons), however, are difficult to measure. To relate the radar energy return to actual wind speed, scientists compare measurements taken from buoys and other ground stations to data the satellite acquired at the same time and place. Because the high wind speeds generated by cyclones are rare, scientists do not have corresponding ground information to know how to translate data from the satellite for wind speeds above 50 knots (about 93 km/hr or 58 mph). Also, the unusually heavy rain found in a cyclone distorts the microwave pulses in a number of ways, making a conversion to accurate wind speed difficult. Instead, the scatterometer provides a nice picture of the relative wind speeds within the storm and shows wind direction.
تاریخ 21:10, 13 May 2006 (UTC)
منبع http://earthobservatory.nasa.gov/NaturalHazards/natural_hazards_v2.php3?img_id=13571
پدیدآور NASA image courtesy of David Long, Brigham Young University, on the QuikSCAT Science Team, and the Jet Propulsion Laboratory.
اجازه‌نامه
(استفادهٔ مجدد از این پرونده)
USGov-PD


Public domain این پرونده در مالکیت عمومی قرار دارد چرا که توسط ناسا ایجاد شده است. سیاست حق تکثیر ناسا بیان می‌کند که «مواد ناسا با حق تکثیر محافظت نمی‌شوند، مگراینکه ذکر شده باشد». (Template:PD-USGov، صفحهٔ سیاست حق تکثیر ناسا یا سیاست جی‌پی‌ال استفاده از تصاویر را ببینید.)
هشدارها:

عنوان

شرحی یک‌خطی از محتوای این فایل اضافه کنید

آیتم‌هایی که در این پرونده نمایش داده شده‌اند

توصیف‌ها

checksum انگلیسی

c5131cf05985b8f7370948a2fb6c03a6f7450837

۱٬۹۹۳٬۹۱۱ بایت

۹۷۴ پیکسل

۹۷۴ پیکسل

تاریخچهٔ پرونده

روی تاریخ/زمان‌ها کلیک کنید تا نسخهٔ مربوط به آن هنگام را ببینید.

تاریخ/زمانبندانگشتیابعادکاربرتوضیح
کنونی‏۱۳ مهٔ ۲۰۰۶، ساعت ۲۱:۱۰تصویر بندانگشتی از نسخهٔ مورخ ‏۱۳ مهٔ ۲۰۰۶، ساعت ۲۱:۱۰۹۷۴ در ۹۷۴ (۱٫۹ مگابایت)Mosesofmason{{Information| |Description= Typhoon Chanchu Typhoon Chanchu is shown here as observed by NASA’s QuikSCAT satellite on May 10, 2005, at 21:11 UTC (5:11 a.m. May 11 local time). At this time, the typhoon had 140 kilometers per hour (85 miles per hour; 7

صفحهٔ زیر از این تصویر استفاده می‌کند:

کاربرد سراسری پرونده

ویکی‌های دیگر زیر از این پرونده استفاده می‌کنند:

فراداده