پرونده:2017- Donald Trump veracity - composite graph.png

پروندهٔ اصلی (۲٬۷۷۵ × ۱٬۷۵۰ پیکسل، اندازهٔ پرونده: ۱۴۱ کیلوبایت، نوع MIME پرونده: image/png)
این پرونده در ویکیانبار موجود است. محتویات صفحهٔ توصیف آن در زیر نمایش داده میشود. |

|
این graph نگاره میبایست با استفاده از گرافیک برداری اسویجی فایل بازسازی شوند. این چند مزیت دارد؛ Commons:Media for cleanup را برای اطلاعات بیشتر ببینید. اگر حالت برداری آن در حال حاضر موجود است، لطفاً آن را بار کنید. پس از بارکردن یک اسویجی، این الگو را با {{vector version available|new image name.svg}} جایگزین کنید.
|
خلاصه
| توضیح |
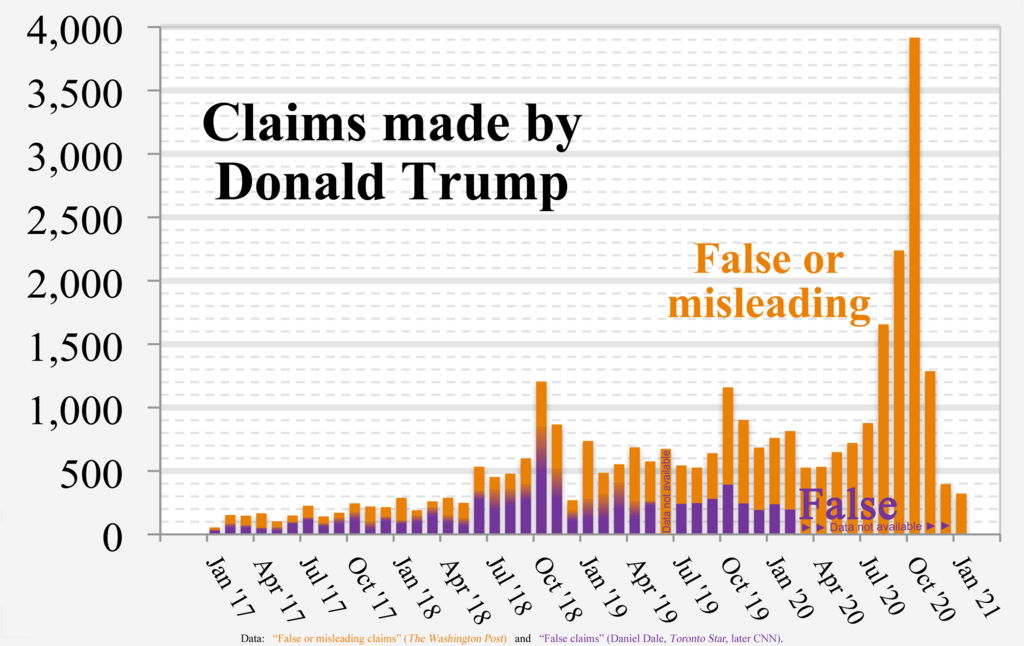
English: Chart of Donald Trump's “False or misleading claims” (The Washington Post) and “False claims” by Daniel Dale (Toronto Star, later CNN)
Technical details:
|
| تاریخ | |
| منبع | اثر شخصی |
| پدیدآور | RCraig09 |
| دیگر نسخهها |
 |
Source data
- Data used to form fact check from The Washington Post is in image description page for File:2017- Donald Trump - graph - false or misleading claims.png
- Data used to form Toronto Star / CNN graph is in collapsible text:
- Versions 1 through 4:
| Click at right to show/hide data for Toronto Star / CNN portions (center of "error bars" in Versions 1-4) |
|---|
|
Month False statements |
- Version 5+:
| Click at right to show/hide data for Toronto Star / CNN portions (below, inside, and above Gradient regions in Version 5) |
|---|
|
Each three of the following data items are "stacked" (violet, below gradient, below orange) to form a full-height column. Month MIN GRADIENT WashPost |
اجازهنامه
- شما اجازه دارید:
- برای به اشتراک گذاشتن – برای کپی، توزیع و انتقال اثر
- تلفیق کردن – برای انطباق اثر
- تحت شرایط زیر:
- انتساب – شما باید اعتبار مربوطه را به دست آورید، پیوندی به مجوز ارائه دهید و نشان دهید که آیا تغییرات ایجاد شدهاند یا خیر. شما ممکن است این کار را به هر روش منطقی انجام دهید، اما نه به هر شیوهای که پیشنهاد میکند که مجوزدهنده از شما یا استفادهتان حمایت کند.
- انتشار مشابه – اگر این اثر را تلفیق یا تبدیل میکنید، یا بر پایه آن اثری دیگر خلق میکنید، میبایست مشارکتهای خود را تحت مجوز یکسان یا مشابه با ا اصل آن توزیع کنید.
تاریخچهٔ پرونده
روی تاریخ/زمانها کلیک کنید تا نسخهٔ مربوط به آن هنگام را ببینید.
| تاریخ/زمان | بندانگشتی | ابعاد | کاربر | توضیح | |
|---|---|---|---|---|---|
| کنونی | ۹ فوریهٔ ۲۰۲۱، ساعت ۰۶:۲۳ | | ۲٬۷۷۵ در ۱٬۷۵۰ (۱۴۱ کیلوبایت) | RCraig09 | Version 16: Eliminate Oct 2016 as irrelevant date to include. Reduced filesize at tinypng.com |
| ۹ فوریهٔ ۲۰۲۱، ساعت ۰۶:۰۸ |  | ۲٬۷۷۵ در ۱٬۷۵۰ (۱۴۰ کیلوبایت) | RCraig09 | Version 15: Update to include final data for January 2021. Reduced filesize at tinypng.com. | |
| ۱۶ ژانویهٔ ۲۰۲۱، ساعت ۰۷:۰۰ |  | ۲٬۷۷۵ در ۱٬۷۵۰ (۵۲۰ کیلوبایت) | RCraig09 | Version 14: Update to include Washington Post data for Nov and Dec 2020 | |
| ۵ ژانویهٔ ۲۰۲۱، ساعت ۲۳:۳۲ |  | ۲٬۷۷۵ در ۱٬۷۵۰ (۵۸۸ کیلوبایت) | RCraig09 | Version 13: Updated to include Washington Post data through October 2020. | |
| ۲۰ دسامبر ۲۰۲۰، ساعت ۲۳:۳۹ |  | ۲٬۷۷۵ در ۱٬۷۵۰ (۴۹۵ کیلوبایت) | RCraig09 | Version 12: Update to include Washington Post data through end of September 2020. | |
| ۱۶ نوامبر ۲۰۲۰، ساعت ۰۷:۲۴ |  | ۲٬۷۷۵ در ۱٬۷۵۰ (۵۳۲ کیلوبایت) | RCraig09 | Version 11: Updating graph to include exact value for August 2020 that no longer involves extrapolation for the last four days of the month. Washington Post added a few more days to their database. | |
| ۲۱ اکتبر ۲۰۲۰، ساعت ۲۲:۲۸ |  | ۲٬۷۷۵ در ۱٬۷۵۰ (۵۳۲ کیلوبایت) | RCraig09 | Version 10: Update to include Washington Post data for July and August 2020. Had to expand vertical scale to accommodate new high in data value (for August 2020). | |
| ۱۳ ژوئیهٔ ۲۰۲۰، ساعت ۰۶:۴۳ |  | ۲٬۷۷۵ در ۱٬۷۵۰ (۵۲۲ کیلوبایت) | RCraig09 | Version 9: updated to include Washington Post data for June 2020. | |
| ۵ ژوئن ۲۰۲۰، ساعت ۰۶:۰۰ |  | ۲٬۷۷۵ در ۱٬۷۵۰ (۵۱۵ کیلوبایت) | RCraig09 | Version 8: Updating to include Washington Post data for April and May 2020 | |
| ۱۵ آوریل ۲۰۲۰، ساعت ۲۰:۲۹ |  | ۲٬۷۷۵ در ۱٬۷۵۰ (۵۸۶ کیلوبایت) | RCraig09 | Version 7: updated to include CNN data for Jan and Feb 2020 |
کاربرد پرونده
صفحهٔ زیر از این تصویر استفاده میکند:
کاربرد سراسری پرونده
ویکیهای دیگر زیر از این پرونده استفاده میکنند:
- کاربرد در ca.wikipedia.org
- کاربرد در en.wikipedia.org
- کاربرد در he.wikipedia.org
- کاربرد در hy.wikipedia.org
- کاربرد در id.wikipedia.org
- کاربرد در ja.wikipedia.org
- کاربرد در pfl.wikipedia.org