پرونده:Thiel-Sen estimator.svg

حجم پیشنمایش PNG این SVG file:۵۷۲ × ۵۹۹ پیکسل کیفیتهای دیگر: ۲۲۹ × ۲۴۰ پیکسل | ۴۵۸ × ۴۸۰ پیکسل | ۷۳۳ × ۷۶۸ پیکسل | ۹۷۸ × ۱٬۰۲۴ پیکسل | ۱٬۹۵۵ × ۲٬۰۴۸ پیکسل | ۲٬۹۳۶ × ۳٬۰۷۵ پیکسل.
پروندهٔ اصلی (پروندهٔ اسویجی، با ابعاد ۲٬۹۳۶ × ۳٬۰۷۵ پیکسل، اندازهٔ پرونده: ۳۷ کیلوبایت)
این پرونده در ویکیانبار موجود است. محتویات صفحهٔ توصیف آن در زیر نمایش داده میشود. |
خلاصه
| توضیح |
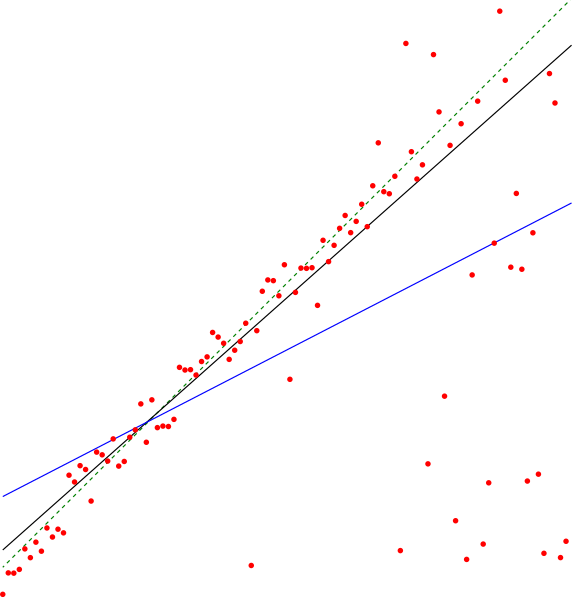
English: The en:Theil–Sen estimator (black line) of a set of sample points, compared to the simple linear regression line (blue). The points were generated by adding a small amount of jitter to points on the green dashed line and then replacing some of the points by random outliers. |
| تاریخ | |
| منبع | اثر شخصی |
| پدیدآور | David Eppstein |
اجازهنامه
من، صاحب حقوق قانونی این اثر، به این وسیله این اثر را تحث اجازهنامهٔ ذیل منتشر میکنم:
| این پرونده تحت CC0 1.0 Universal Public Domain Dedication کریتیو کامنز قابل دسترسی است. | |
| کسی که اثری را با این سند همراه کرده است، با چشمپوشی از تمام حقوق خود نسبت به اثر در جهان تحت قانون کپیرایت و همهٔ حقوق قانونی مرتبط یا همسایهای که او در اثر داشته است، تا حد مجاز در قانون، آن را به مالکیت عمومی اهدا کرده است. شما میتوانید بدون گرفتن اجازه این اثر را تکثیر کنید، تغییر دهید، منتشر کنید یا دوباره ایجاد کنید، حتی اگر مقاصد تجاری داشته باشید.
|
Source code
This image was created as a pdf file by the following Python code, then converted to SVG.
from pyx import canvas,path,color
from random import random,seed
seed(12345)

N = 103
noise = 10
slope = 1.0

def sample(x):
    y = x * slope
    if random() < (y/N)**3:
        y = random()*N      # outlier
    else:
        y += (random()-0.5)*noise # non-outlier, jitter
    return y

samples = [(i*1.0,sample(i)) for i in range(N)]

c = canvas.canvas()

for x,y in samples:
    c.fill(path.circle(x,y,0.5),[color.rgb.red])

def theilsen(samples):
    N = len(samples)
    def slope(i,j):
        xi,yi = samples[i]
        xj,yj = samples[j]
        return (yi-yj)/(xi-xj)

    def median(L):
        L.sort()
        if len(L) & 1:
            return L[len(L)//2]
        else:
            return (L[len(L)//2 - 1] + L[len(L)//2])/2.0

    m = median([slope(i,j) for i in range(N) for j in range(i)])

    def error(i):
        x,y = samples[i]
        return y - m*x

    b = median([error(i) for i in range(N)])

    return m,b

m,b = 1,0
c.stroke(path.line(0,b,N,N*m+b),[color.rgb.green])

m,b = theilsen(samples)
c.stroke(path.line(0,b,N,N*m+b),[color.rgb.black])

def slr(samples):
    N = len(samples)
    sumxy = sum([x*y for x,y in samples])
    sumx = sum([x for x,y in samples])
    sumy = sum([y for x,y in samples])
    sumxx = sum([x*x for x,y in samples])
    m = (sumxy - sumx*sumy/N)/(sumxx - sumx**2/N)
    b = sumy/N - m*sumx/N
    return m,b

m,b = slr(samples)
c.stroke(path.line(0,b,N,N*m+b),[color.rgb.blue])

c.writePDFfile("ThielSen")
تاریخچهٔ پرونده
روی تاریخ/زمانها کلیک کنید تا نسخهٔ مربوط به آن هنگام را ببینید.
| تاریخ/زمان | بندانگشتی | ابعاد | کاربر | توضیح | |
|---|---|---|---|---|---|
| کنونی | ۳ نوامبر ۲۰۱۱، ساعت ۱۸:۵۹ | | ۲٬۹۳۶ در ۳٬۰۷۵ (۳۷ کیلوبایت) | David Eppstein | Darker green, thicker lines |
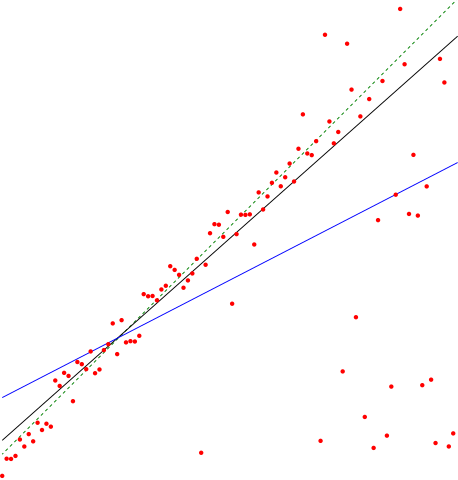
| ۳ ژوئیهٔ ۲۰۱۱، ساعت ۲۳:۴۰ |  | ۲٬۹۳۶ در ۳٬۰۷۵ (۳۷ کیلوبایت) | David Eppstein | {{Information |Description ={{en|1=The en:Theil–Sen estimator (black line) of a set of sample points, compared to the simple linear regression line (blue). The points were generated by adding a small amount of jitter to points on the green dashe |
کاربرد پرونده
صفحهٔ زیر از این تصویر استفاده میکند:
کاربرد سراسری پرونده
ویکیهای دیگر زیر از این پرونده استفاده میکنند:
- کاربرد در ar.wikipedia.org
- کاربرد در el.wiktionary.org
- کاربرد در en.wikipedia.org
- کاربرد در es.wikipedia.org
- کاربرد در hy.wikipedia.org
- کاربرد در ko.wikipedia.org
- کاربرد در ru.wikipedia.org
- کاربرد در zh.wikipedia.org