پرونده:Voltage regulator foldback.svg

حجم پیشنمایش PNG این SVG file:۲۷۸ × ۲۷۶ پیکسل کیفیتهای دیگر: ۲۴۲ × ۲۴۰ پیکسل | ۴۸۳ × ۴۸۰ پیکسل | ۷۷۴ × ۷۶۸ پیکسل | ۱٬۰۳۱ × ۱٬۰۲۴ پیکسل | ۲٬۰۶۳ × ۲٬۰۴۸ پیکسل.
پروندهٔ اصلی (پروندهٔ اسویجی، با ابعاد ۲۷۸ × ۲۷۶ پیکسل، اندازهٔ پرونده: ۴۵ کیلوبایت)
این پرونده در ویکیانبار موجود است. محتویات صفحهٔ توصیف آن در زیر نمایش داده میشود. |
خلاصه
| توضیح |
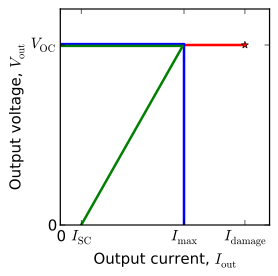
English: Voltage regulator V-I curves for foldback, current limited, and unlimited. |
| تاریخ | |
| منبع | اثر شخصی |
| پدیدآور | Nanite |
| SVG genesis | این گرافیک با کد نامعتبر از لحاظ W3C با Matplotlib ساخته شده است |
| کد منبع | Python code#Requires [[:wikipedia:matplotlib|matplotlib]]. Due to a bug in wikipedia's SVG renderer,
#the raw files appear with curves peeking outside of the axes.
#Before uploading the files were touched up by releasing and re-setting the clip paths.
from pylab import *
figtype = '.svg'
saveopts = {'bbox_inches':'tight'} #, 'transparent':True, 'frameon':True}
seterr(divide='ignore')
V_fb = concatenate([linspace(9.95,9.95,100, endpoint=False), linspace(9.95,0,101)])
I_fb = concatenate([linspace(0,0.995,100, endpoint=False), linspace(0.995,0.17,101)])
V_cl = concatenate([linspace(10.05,10.05,100, endpoint=False), linspace(10.05,0,101)])
I_cl = concatenate([linspace(0,1.005,100, endpoint=False), linspace(1.005,1.005,101)])
V_nl = linspace(10,10,151)
I_nl = linspace(0,1.5,151)
# Compute powers; Assume regulator is dropping voltage from a source 20% higher than V_oc.
P_cl = I_cl*(V_cl[0]*1.2 - V_cl)
P_fb = I_fb*(V_fb[0]*1.2 - V_fb)
P_nl = I_nl*(V_nl[0]*1.2 - V_nl)
Gcrit = 0.1
Rcrit = 10
Pcrit = 2
### Make V-I curve plot
fig = figure()
ax = axes()
xlim(0,1.7)
ylim(0,12)
ax.set_xlabel('Output current, $I_{\\rm out}$')
ax.set_xticks([I_fb[0], I_fb[-1], max(I_cl), max(I_nl)])
ax.set_xticklabels(['0', '$I_{\\rm SC}$', '$I_{\\rm max}$', '$I_{\\rm damage}$'])
ax.set_ylabel('Output voltage, $V_{\\rm out}$')
ax.set_yticks([0,10])
ax.set_yticklabels(['0', '$V_{\\rm OC}$'])
ax.plot(I_nl, V_nl, 'r', linewidth=2)
ax.plot([I_nl[-1]], [V_nl[-1]], 'r*', linewidth=2)
ax.plot(I_cl, V_cl, 'b', linewidth=2)
ax.plot(I_fb, V_fb, 'g', linewidth=2)
fig.set_size_inches(3,3)
fig.patch.set_alpha(0)
savefig('foldback-vi'+figtype, **saveopts)
### Make power and resistance load plot
fig = figure()
ax = axes()
xlim(0,0.5)
ylim(0,13)
ax.set_xlabel('Load conductance ($\Omega^{-1}$)')
#ax.set_xticks([0,0.1])
#ax.set_xticklabels(['0', '$G_{\\rm crit}$'])
ax.set_ylabel('Regulator heating power (W)')
ax.set_yticks([0,
round(P_fb[100],1),
round(max(P_fb),1),
round(P_fb[-1],1),
round(P_cl[-1],1)])
#ax.set_yticklabels(['0', '$P_{\\rm max,FB}$', '$P_{\\rm SC,FB}$','$P_{\\rm SC,CL}$'])
# Plot heat in regulator vs. conductance
ax.axvline(Gcrit, color='#777777', linestyle='dashed', linewidth=0.5)
ax.axhline(P_fb[-1], color='#777777', linestyle='dashed', linewidth=0.5)
ax.axhline(P_cl[-1], color='#777777', linestyle='dashed', linewidth=0.5)
ax.plot(I_nl/V_nl, P_nl, 'r', linewidth=2)
ax.plot([(I_nl/V_nl)[-1]], [P_nl[-1]], 'r*', linewidth=2)
ax.plot(I_cl/V_cl, P_cl, 'b', linewidth=2)
ax.plot(I_fb/V_fb, P_fb, 'g', linewidth=2)
ax.text(Gcrit/2, 9, 'OK', horizontalalignment='center')
ax.text(0.3, 9, 'Overload', horizontalalignment='center')
fig.set_size_inches(3,3)
fig.patch.set_alpha(0)
savefig('foldback-loadcon'+figtype, **saveopts)
### Make power and conductance load plot
fig = figure()
ax = axes()
xlim(0,16)
ylim(0,13)
ax.set_xlabel('Load resistance ($\Omega$)')
ax.set_xticks([0,5,10,15])
#ax.set_xticklabels(['0', '$G_{\\rm crit}$'])
ax.set_ylabel('Dissipation in regulator (W)')
#ax.set_yticks([0,
# round(P_fb[100],1),
# round(max(P_fb),1),
# round(P_fb[-1],1),
# round(P_cl[-1],1)])
#ax.set_yticklabels(['0', '$P_{\\rm max,FB}$', '$P_{\\rm SC,FB}$','$P_{\\rm SC,CL}$'])
# Plot heat in regulator vs. resistance
amfb = argmax(P_fb)
# grey lines
ax.axvline(Rcrit, color='#777777', linestyle='dashed', linewidth=0.5)
ax.plot([0,V_fb[amfb]/I_fb[amfb]], [P_fb[amfb]]*2, color='#777777', linestyle='dashed', linewidth=0.5)
ax.plot([0,Rcrit],[Pcrit,Pcrit], color='#777777', linestyle='dashed', linewidth=0.5)
#curves
ax.plot(V_nl/I_nl, P_nl, 'r', linewidth=2)
ax.plot([(V_nl/I_nl)[-1]], [P_nl[-1]], 'r*', linewidth=2)
ax.plot(V_cl/I_cl, P_cl, 'b', linewidth=2)
ax.plot(V_fb/I_fb, P_fb, 'g', linewidth=2)
ax.text(Rcrit/2, 12, 'Overloaded', horizontalalignment='center')
ax.text(13, 12, 'Normal', horizontalalignment='center')
fig.set_size_inches(3,3)
fig.patch.set_alpha(0)
savefig('foldback-loadres'+figtype, **saveopts)
|
اجازهنامه
من، صاحب حقوق قانونی این اثر، به این وسیله این اثر را تحث اجازهنامهٔ ذیل منتشر میکنم:
| این پرونده تحت CC0 1.0 Universal Public Domain Dedication کریتیو کامنز قابل دسترسی است. | |
| کسی که اثری را با این سند همراه کرده است، با چشمپوشی از تمام حقوق خود نسبت به اثر در جهان تحت قانون کپیرایت و همهٔ حقوق قانونی مرتبط یا همسایهای که او در اثر داشته است، تا حد مجاز در قانون، آن را به مالکیت عمومی اهدا کرده است. شما میتوانید بدون گرفتن اجازه این اثر را تکثیر کنید، تغییر دهید، منتشر کنید یا دوباره ایجاد کنید، حتی اگر مقاصد تجاری داشته باشید.
|
تاریخچهٔ پرونده
روی تاریخ/زمانها کلیک کنید تا نسخهٔ مربوط به آن هنگام را ببینید.
| تاریخ/زمان | بندانگشتی | ابعاد | کاربر | توضیح | |
|---|---|---|---|---|---|
| کنونی | ۲ اوت ۲۰۱۳، ساعت ۰۶:۴۱ | | ۲۷۸ در ۲۷۶ (۴۵ کیلوبایت) | Nanite | labels, transparency |
| ۱ اوت ۲۰۱۳، ساعت ۱۴:۱۷ |  | ۲۷۸ در ۲۷۴ (۲۵ کیلوبایت) | Nanite | User created page with UploadWizard |
کاربرد پرونده
صفحهٔ زیر از این تصویر استفاده میکند:
کاربرد سراسری پرونده
ویکیهای دیگر زیر از این پرونده استفاده میکنند:
- کاربرد در ca.wikipedia.org
- کاربرد در en.wikipedia.org
- کاربرد در it.wikibooks.org